
136 | Simulated Dendrochronology of U.S. Immigration with Pedro Cruz and John Wihbey
Data Stories
English - March 07, 2019 14:55 - 39 minutes - 28 MB - ★★★★★ - 388 ratingsVisual Arts Arts fitness interview leadership entrepreneurship health business lifestyle finance marketing entrepreneur Homepage Download Apple Podcasts Google Podcasts Overcast Castro Pocket Casts RSS feed
We have Pedro Cruz and John Wihbey on the show to talk about their beautiful project, the Simulated Dendrochronology of U.S. Immigration.
podlovePlayerCache.add([{"url":"https:\/\/datastori.es\/wp-json\/podlove-web-player\/shortcode\/publisher\/3656","data":{"version":5,"show":{"title":"Data Stories","subtitle":"A podcast on data and how it affects our lives \u2014 with Enrico Bertini and Moritz Stefaner","summary":"Enrico Bertini and Moritz Stefaner discuss the latest developments in data analytics, visualization and related topics.","poster":"https:\/\/datastori.es\/wp-content\/cache\/podlove\/f1\/aea5f20a523df5a96daae43b938a55\/data-stories_500x.png","link":"https:\/\/datastori.es"},"title":"Simulated Dendrochronology of U.S. Immigration with Pedro Cruz and John Wihbey","subtitle":"","summary":"We have Pedro Cruz and John Wihbey on the show to talk about their beautiful project, the Simulated Dendrochronology of U.S. Immigration.","publicationDate":"2019-03-07T15:55:39+01:00","duration":"00:39:09.700","poster":"https:\/\/datastori.es\/wp-content\/cache\/podlove\/20\/5d4082908b684740336c0a85ffc00f\/simulated-dendrochronology-of-u-s-immigration-with-pedro-cruz-and-john-wihbey_500x.png","link":"https:\/\/datastori.es\/simulated-dendrochronology-of-u-s-immigration-with-pedro-cruz-and-john-wihbey\/","chapters":[{"start":"00:00:25.650","title":"Welcome to Data Stories!","href":"","image":""},{"start":"00:00:58.957","title":"There are no ads on Data Stories because we're listener-supported; please consider contributing to the show!","href":"https:\/\/patreon.com\/datastories","image":""},{"start":"00:01:37.225","title":"A new Data Stories update: we're on Instagram!","href":"https:\/\/www.instagram.com\/datastories_podcast\/","image":""},{"start":"00:01:59.130","title":"Introducing today's episode on Simulated Dendrochronology","href":"https:\/\/web.northeastern.edu\/naturalizing-immigration-dataviz\/","image":""},{"start":"00:02:20.657","title":"Introducing Pedro Cruz","href":"http:\/\/pmcruz.com\/","image":""},{"start":"00:02:50.765","title":"Introducing John Wihbey","href":"https:\/\/camd.northeastern.edu\/faculty\/john-p-wihbey\/","image":""},{"start":"00:03:35.391","title":"What is Dendrochronology?","href":"","image":""},{"start":"00:04:52.965","title":"How does the visualization work?","href":"","image":""},{"start":"00:07:50.103","title":"Where did the idea for this visualization come from?","href":"","image":""},{"start":"00:12:48.592","title":"How did you implement the tree ring idea and come up with an algorithm?","href":"","image":""},{"start":"00:18:40.062","title":"Why the tree cross section was an especially appropriate metaphor for immigration","href":"","image":""},{"start":"00:30:02.586","title":"Tips and resources for further exploration into metaphors","href":"","image":""},{"start":"00:31:45.246","title":"The project's reception","href":"","image":""},{"start":"00:37:30.145","title":"Get in touch with us and support us on Patreon","href":"https:\/\/www.patreon.com\/datastories","image":""}],"audio":[{"url":"https:\/\/datastori.es\/podlove\/file\/5623\/s\/webplayer\/c\/website\/136-simulated-dendrochronology-of-us-immigration-with-pedro-cruz-and-john-wihbey.m4a","size":"29403806","title":"MPEG-4 AAC Audio (m4a)","mimeType":"audio\/mp4"},{"url":"https:\/\/datastori.es\/podlove\/file\/5622\/s\/webplayer\/c\/website\/136-simulated-dendrochronology-of-us-immigration-with-pedro-cruz-and-john-wihbey.mp3","size":"37675504","title":"MP3 Audio (mp3)","mimeType":"audio\/mpeg"}],"files":[{"url":"https:\/\/datastori.es\/podlove\/file\/5622\/s\/webplayer\/136-simulated-dendrochronology-of-us-immigration-with-pedro-cruz-and-john-wihbey.mp3","size":"37675504","title":"MP3 Audio","mimeType":"audio\/mpeg"},{"url":"https:\/\/datastori.es\/podlove\/file\/5623\/s\/webplayer\/136-simulated-dendrochronology-of-us-immigration-with-pedro-cruz-and-john-wihbey.m4a","size":"29403806","title":"MPEG-4 AAC Audio","mimeType":"audio\/mp4"}],"contributors":[]}}, {"url":"https:\/\/datastori.es\/wp-json\/podlove-web-player\/shortcode\/config\/ds\/theme\/ds","data":{"activeTab":"chapters","subscribe-button":{"feed":"https:\/\/datastori.es\/feed\/podcast\/","clients":[{"id":"overcast","service":null},{"id":"stitcher","service":null},{"id":"spotify","service":null},{"id":"pocket-casts","service":null},{"id":"google-podcasts","service":null},{"id":"apple-podcasts","service":null},{"id":"rss","service":null}]},"share":{"channels":["facebook","twitter","whats-app","linkedin","pinterest","xing","mail","link"],"outlet":"https:\/\/datastori.es\/wp-content\/plugins\/podlove-web-player\/web-player\/share.html","sharePlaytime":true},"related-episodes":{"source":"disabled","value":null},"version":5,"theme":{"tokens":{"brand":"#5728b1","brandDark":"#47309b","brandDarkest":"#221064","brandLightest":"#FFF","shadeDark":"#47309b","shadeBase":"#5728b1","contrast":"#221064","alt":"#fff"},"fonts":{"ci":{"name":"","family":[" AvenirNext"," Avenir Next","Segoe UI","-apple-system","BlinkMacSystemFont","Roboto","Helvetica","Arial","sans-serif","Apple Color Emoji","Segoe UI Emoji\", \"Segoe UI Symbol"],"src":[],"weight":"600"},"regular":{"name":"regular","family":["AvenirNext","Avenir Next","Segoe UI","-apple-system","BlinkMacSystemFont","Roboto","Helvetica","Arial","sans-serif","Apple Color Emoji","Segoe UI Emoji\", \"Segoe UI Symbol"],"src":[],"weight":300},"bold":{"name":"bold","family":["AvenirNext","Avenir Next","-apple-system","BlinkMacSystemFont","Segoe UI","Roboto","Helvetica","Arial","sans-serif","Apple Color Emoji","Segoe UI Emoji\", \"Segoe UI Symbol"],"src":[],"weight":700}}},"base":"https:\/\/datastori.es\/wp-content\/plugins\/podlove-web-player\/web-player\/"}}]);
podlovePlayer("#player-5fc64b4284527", "https://datastori.es/wp-json/podlove-web-player/shortcode/publisher/3656", "https://datastori.es/wp-json/podlove-web-player/shortcode/config/ds/theme/ds");
[There are no ads on Data Stories because we’re listener-supported; please consider contributing to the show! Oh…and now Data Stories is on Instagram!]
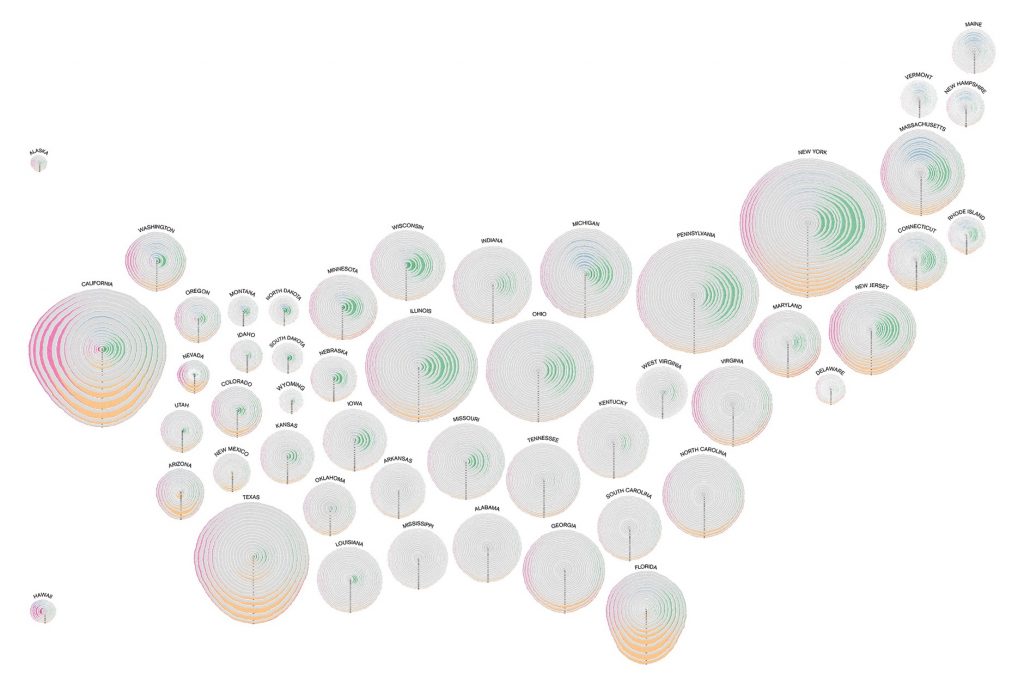
We have Pedro Cruz and John Wihbey on the show to talk about their beautiful project, the Simulated Dendrochronology of U.S. Immigration. There are many ways that immigration can be represented visually, but Pedro and John came up with a very compelling one: they use the metaphor of tree rings to show how migration patterns of people to the United States have changed over time. The final piece is utterly beautiful and evocative: we are the product of many layers of immigration.
On the show we talk about how they came up with this idea, the implementation of the visualization, the attempts they tried before producing the final version, and the role of metaphors in visualization. Make sure you take a closer look at the visualization before listening!
And enjoy the show!
Links
Project Page and VideoPedro CruzJohn WihbeyGeorge Lakoff and Mark Johnson, Metaphors We Live ByAndrew Ortony, “Metaphor and Representation” in Metaphor and ThoughtDonna Cox “The Art and Science of Visualization: Metaphorical Maps and Cultural Models”John’s upcoming book: The Social Fact (MIT Press, April 2019)